The code also includes last post's stuff (the speed consistency vs. direction plots). Again, even/odd wheel numbers are in their own trend groups, and as the number of motors go up the standard deviation of the efficiency with respect to direction goes down.
The efficiency plots:
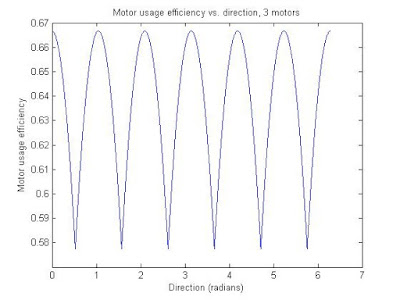
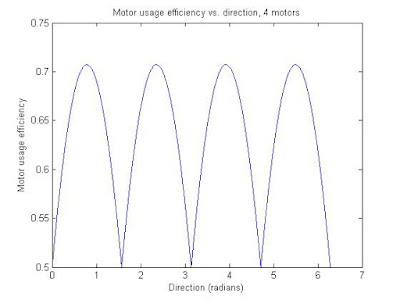
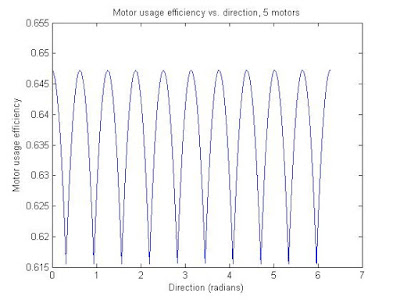
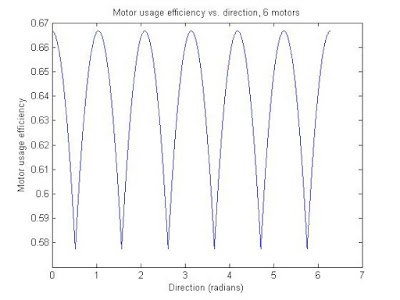
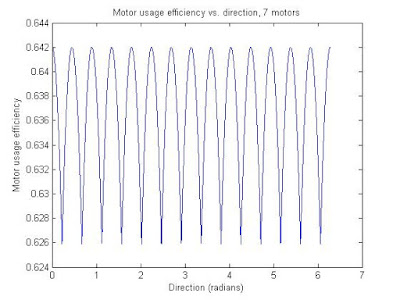
The code:
%FPS bot testingclose all;offsetAngles = [0 0 0 0 0];%Just the difference in angle between frontmost motor and forward direction.motorCounts = [3 4 5 6 7];motorAngles = 2*pi./motorCounts;for j = 1:numel(motorCounts)mvec = zeros(motorCounts(j),2);for k = 1:motorCounts(j)mvec(k,:) = [cos(offsetAngles(j)+(k-1)*motorAngles(j)) -sin(offsetAngles(j)+(k-1)*motorAngles(j))];endresolution = 10000;theta = linspace(0,2*pi,resolution)';directionVector = zeros(resolution,2);directionVector(:,1) = cos(theta);directionVector(:,2) = sin(theta);%Speedmag = zeros(resolution,1);currentMag = zeros(motorCounts(j),1);for k=1:resolutionfor i=1:motorCounts(j)currentMag(i) = abs(mvec(i,:)*directionVector(k,:)');endmag(k) = max(currentMag);endfigure;plot(theta,mag);ylabel('Normalized speed magnitude');xlabel('Direction (radians)');title(['Normalized speed magnitude vs. direction, ' num2str(motorCounts(j)) ' motors']);%TorquemotorUse = zeros(resolution,1);for k=1:resolutionfor m=1:motorCounts(j)motorUse(k) = motorUse(k)+abs(mvec(m,:)*directionVector(k,:)');endendfigure;plot(theta,motorUse);ylabel('Equivalent motor usage (# of motors)');xlabel('Direction (radians)');title(['Motor usage vs. direction, ' num2str(motorCounts(j)) ' motors']);figure;plot(theta,motorUse/motorCounts(j));ylabel('Motor usage efficiency');xlabel('Direction (radians)');title(['Motor usage efficiency vs. direction, ' num2str(motorCounts(j)) ' motors']);end
No comments:
Post a Comment